01
Read the funnel
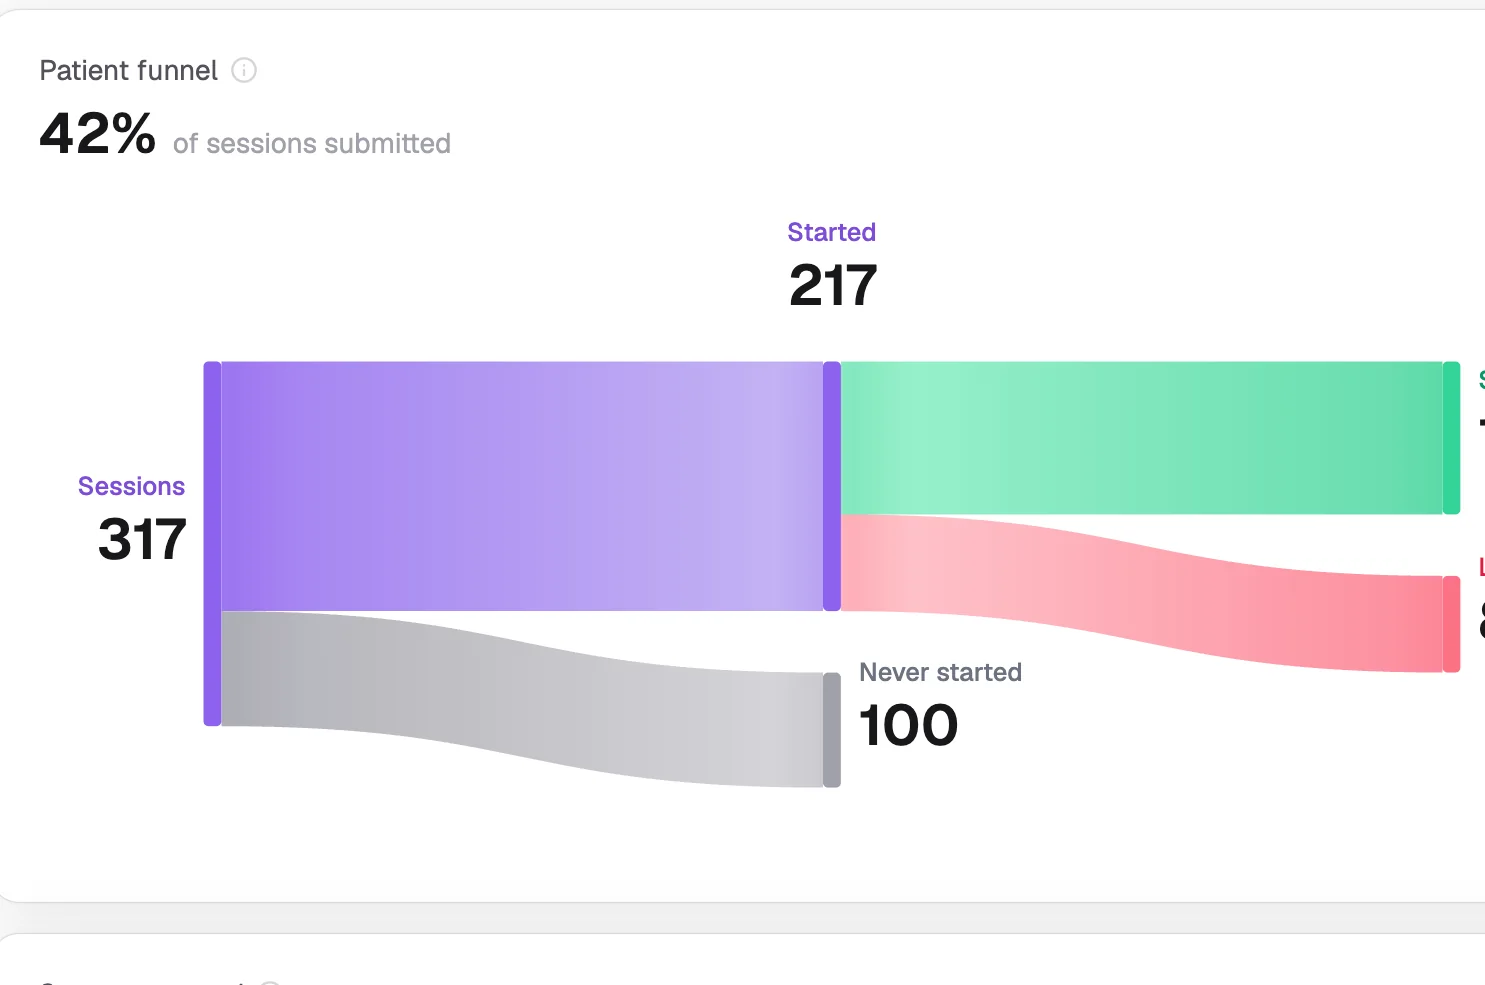
Sessions, patients who started, patients who submitted, and the ones lost on the way, in one view. Completion stops being a single number you can't act on.

Step-level funnel analytics and A/B testing built for health intake, not generic web traffic.
A health intake flow can fail in many places: a question that confuses patients and causes them to quit, an eligibility criterion so strict that too many qualified patients are rejected, a checkout step that arrives too early before trust has been established. Without step-level data, you're guessing which problem to solve.
Generic web analytics (page views, bounce rate) don't tell you any of this. PathwAI's analytics are built specifically for the intake funnel, each step is tracked independently, so you see the exact shape of patient behavior through your flow.
Read the funnel, find the step that leaks, fix it, and watch the number move.
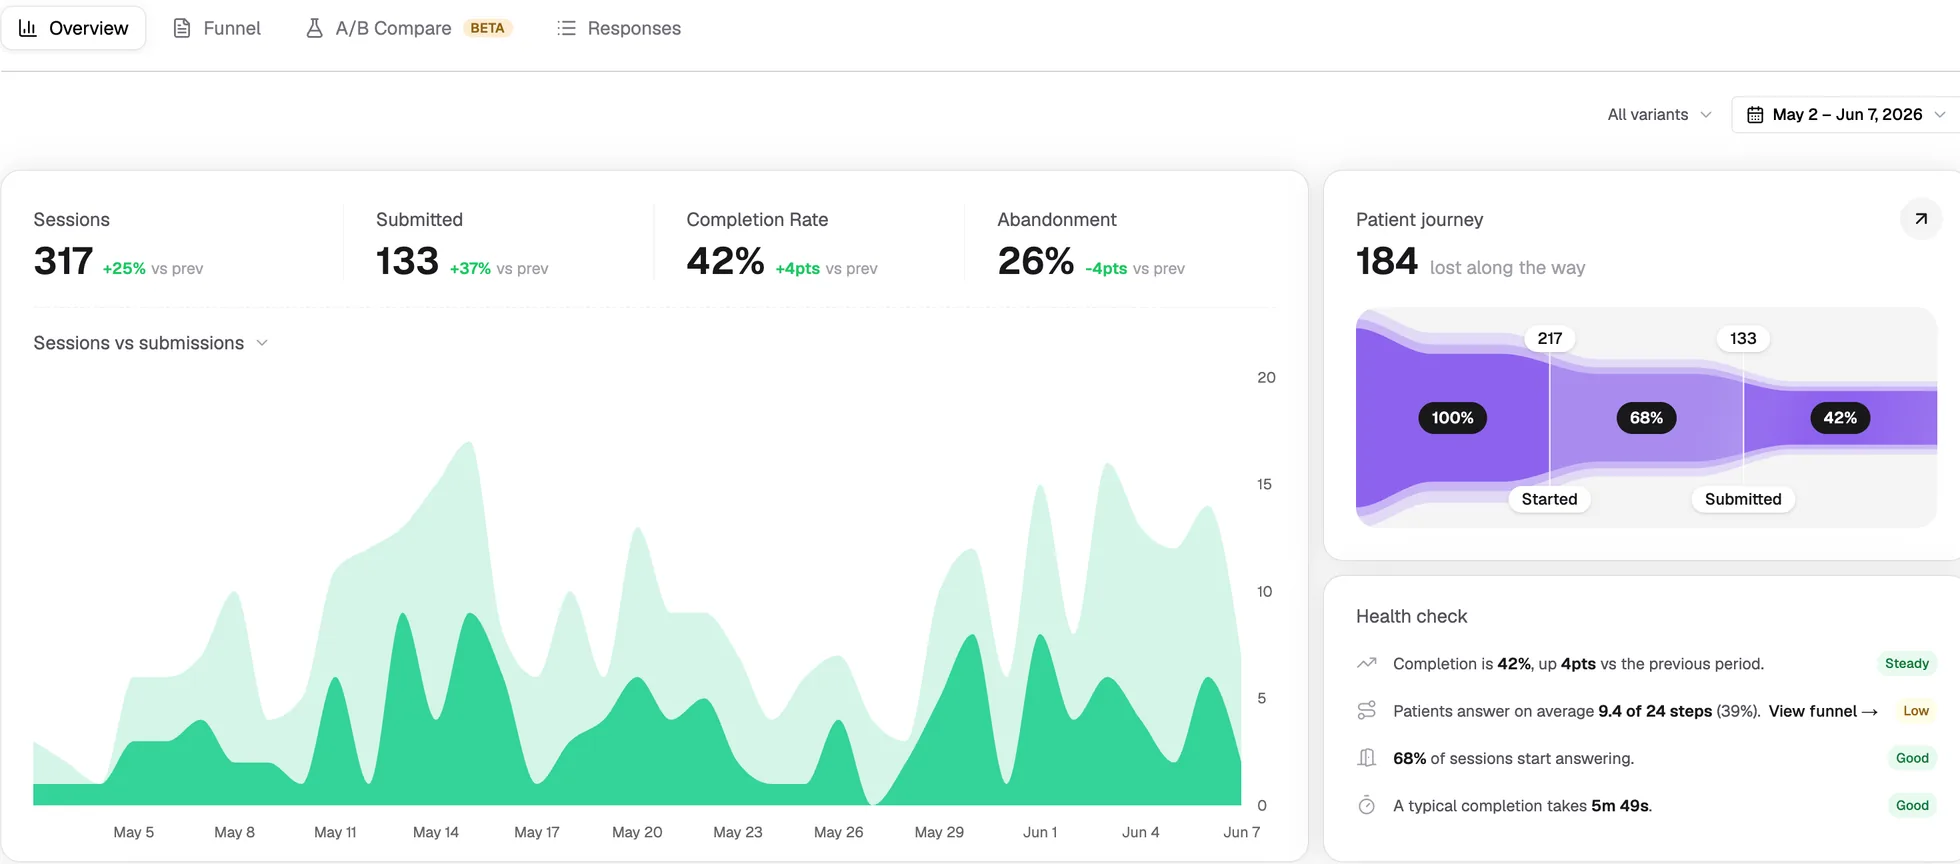
Sessions, patients who started, patients who submitted, and the ones lost on the way, in one view. Completion stops being a single number you can't act on.
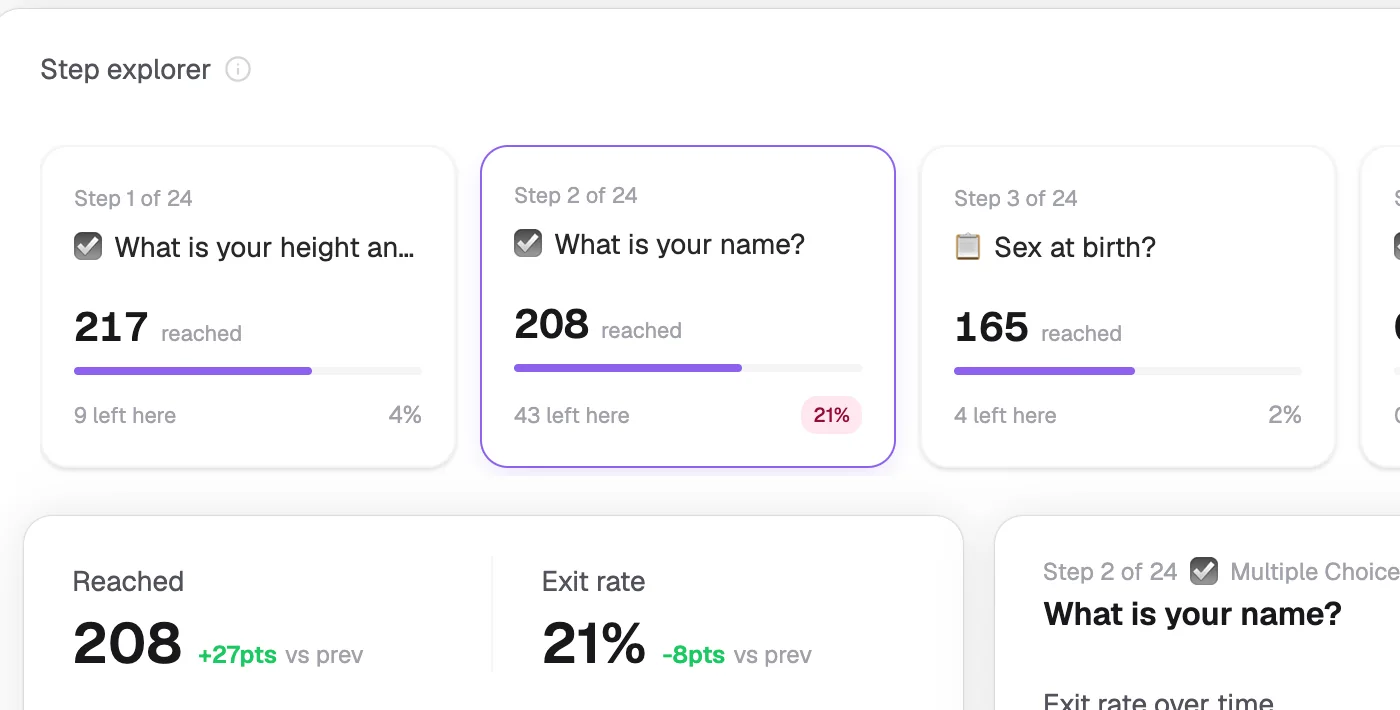
Every screen reports how many patients reached it and how many left there. The worst step is obvious instead of buried in an overall conversion rate.
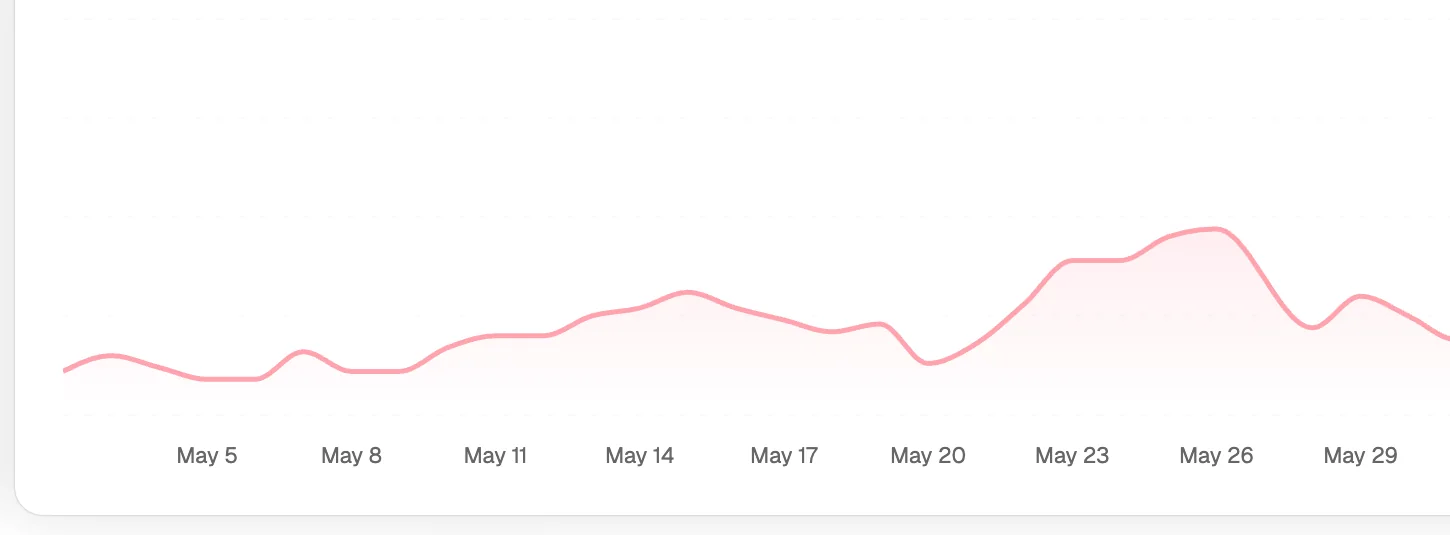
Edit the step in the builder, A/B test it against the control, and track the exit rate day by day. The team that read the data ships the fix the same day.
Not page views and bounce rates. Step-by-step patient behavior data that tells you what to fix next.
Step-level analytics answer the questions that matter for health intake performance.
Which step has the highest abandonment rate, so you know where to start.
Which eligibility question disqualifies the most patients, and whether that matches your clinical intent or is a miscalibration.
Does adding a progress indicator before the intake section improve completion, and by how much.
Which version of the checkout CTA results in more completed checkouts when tested against each other.
What percentage of patients reach the final step but don't complete checkout, and what's happening in that last drop.
We'll show you how step-level analytics and A/B testing work for a flow similar to yours, and what the first meaningful improvement usually looks like after launch.
Book a Demo Product overview